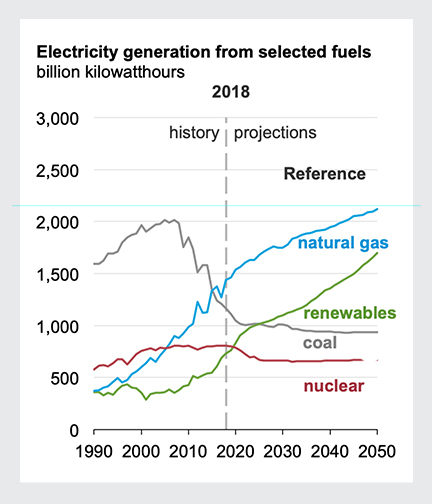
IEO 2019 report points to the critical role of natural gas; projects conventional power sources (CPS) to outpace renewables for total electricity generation in 2050, 68% to 32%.
Key Learnings:
According to IEO 2019 report, in North America:
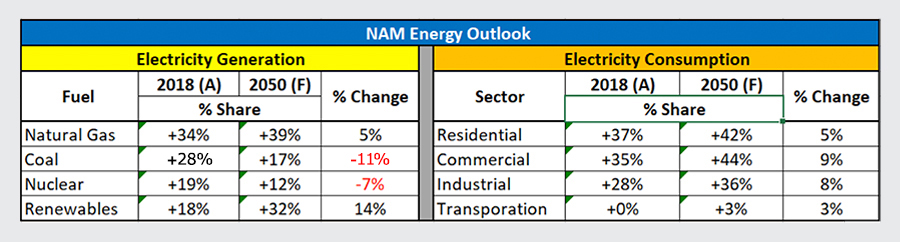
- CPS generated 81% and RES generated 19% of the total electrical energy in CY2018
- By CY2050:
– Natural gas-fired generation will contribute nearly 40%, up by 5% from 2018
– Coal and Nuclear generation will contribute about 28%, down by 18% from 2018
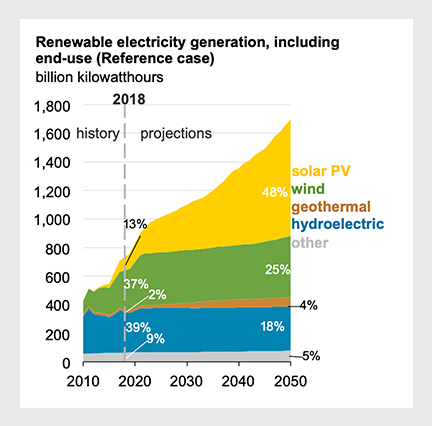
– Renewables will contribute about 32%, up by 14% from 2018
In other words, CPS will generate 68% and RES will generate 32% of the total electrical energy. - Natural gas and renewables will be the primary sources of new capacity additions to replace older, less-efficient fossil fuel capacity
- The electricity market is evolving from a centralized and monopolized system to a highly competitive system where consumers become prosumers — producing and consuming the required energy
- The falling costs of wind and solar technologies, commercially viable energy storage technology, and energy-efficient consumer products are driving the optimum generation mix.
- The digital revolution, adoption of big data, and internet-based applications are making bulk power systems more intelligent and interactive
Overview
The global power industry is transforming at several fronts, most notably the real-time shift toward renewable energy sources (RES) and its growing influence on the economic viability of conventional power sources (CPS). The root cause of the transformation is political and social pressure to produce and consume clean energy. It will revolutionize the way electricity is produced, distributed, stored, and marketed.
The electrical energy industry consists of complex and complicated domains, namely:
D1: Power Generation
D2: Electric Utility
D3: Electricity Market
D4: Technology
D5: Energy Policy
D6: Economy
D7: Environment
There are cause-and-effect relationships within a domain and among domains. It is crucial to clearly understand the roles and responsibilities of each domain to successfully transition to our clean energy future. Over the course of the next few months we will attempt to analyze them individually and simplify their internal complexities and influences on the overall industry.
Global Electric Energy Outlook: 2018 – 2050
The U.S. Energy Information Administration (EIA) develops an International Energy Outlook (IEO) using an integrated economic model that captures long-term relationships among energy supply, demand, and prices considering future developments in technology, demographic changes, economic trends, and resource availability that drive energy consumption.
For our pragmatic analysis we have considered the impact of economic growth on energy consumption. Using IEO 2019 reference case for 3.0% per year growth rate of global gross domestic product (GDP) throughout the projection period, the analysis shows:
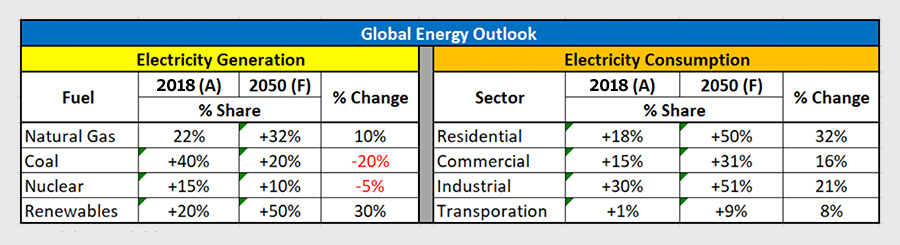
Note: (A) – Actual, (F) – Forecast
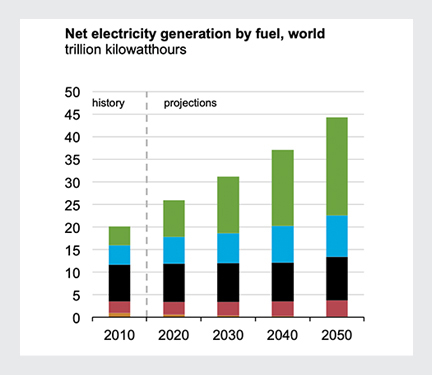
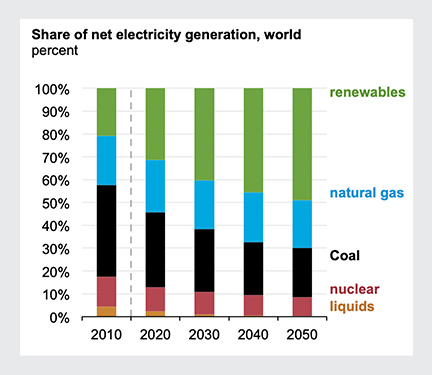
- Natural gas-fired generation will remain a major source of electricity through 2050 while coal and nuclear generation decline.
- Renewables will generate about 50% of the total world electricity and surpass coal by 2025.
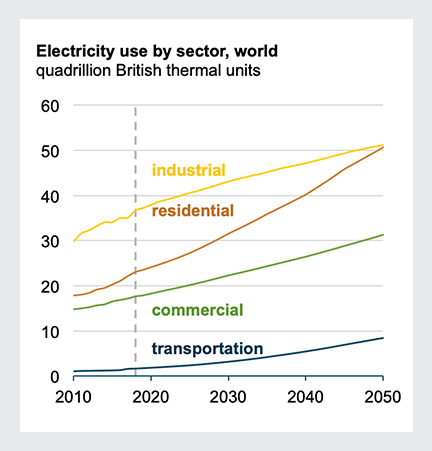
- With modest GDP growth, consumption will steadily rise in every sector with largest growth in residential sector.
North American Energy Outlook: 2018 – 2050
Energy market projections are subject to uncertainty due to technological innovations, demographic changes, political and social influence, economic trends, and resources. According to the AEO2019 report, the North American energy outlook closely follows the global energy outlook.
Note: (A) – Actual, (F) – Forecast
- Even with the declining share of coal and nuclear generation, CPS will continue to outpace renewables, 68% to 32% in 2050.
- Most of the new wind and solar capacity would enter service between 2018 and 2021, before Production Tax Credits (PTC) for wind and Investment Tax Credit (ITC) for solar expire.

- The primary drivers for new capacity addition are the retirement of uneconomical and less-efficient fossil fuel units, renewable energy tax credits, and declining costs of renewables.
- Low natural gas prices and favorable costs for renewables result in natural gas and renewables as the primary sources of new generation capacity.
It is evident from the analysis that CPS will remain the dominant player throughout transition to our clean energy future. Based on the data one can also argue that renewables may never outpace CPS since it could only grow less than 20% in the next 3 decades.
What is the magic formula that can determine the realistic roles of CPS and RES to meet the steady growth of electricity consumption with reliable and clean energy?
In my view, the answer lies in finding balance among reliable generation, stable delivery system, and efficient energy consumption.


With the modest GDP growth energy consumption will steadily rise in every sector. To meet the growing demand for reliable energy supply CPS will contribute 2/3rd and RES will contribute 1/3rd of the total electrical energy required throughout the projection period.
Over the next several months, we will take a deeper dive into the aforementioned electrical energy industry domains, exploring their individual and collective impacts on the evolving makeup of electricity generation. In the meantime, if you have comments or questions on our project, we invite you to engage with us below, on LinkedIn and Twitter, or to contact us directly.